Difference between revisions of "Conceptual modeling"
m (→Conceptual model development) |
m (→Conceptual model development) |
||
| Line 24: | Line 24: | ||
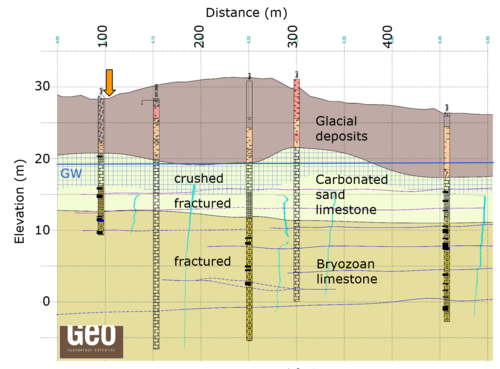
[[File:Geology_Akacievej_GEO_extended.png|thumb|500px|Fig.1: Geology at the Akacievej site.]] | [[File:Geology_Akacievej_GEO_extended.png|thumb|500px|Fig.1: Geology at the Akacievej site.]] | ||
=== Geologic model === | === Geologic model === | ||
| − | Data from boreholes, borehole cores, | + | Data from boreholes (drilling reports), borehole cores, geophysical measurements, larger-scale geologic maps and expert knowledge were combined to setup a 3D geologic model using the software GeoScene3D. |
| − | The top of the limestone layer, the transition from crushed to fractured limestone and the transition from the København's kalk to bryozoan limestone were determined in | + | The top of the limestone layer, the transition from crushed to fractured limestone and the transition from the København's kalk to bryozoan limestone were determined in an array of boreholes and the data was spatially interpolated to obtain 3D surfaces that can be used in a numerical flow and transport model. |
A cross section of the geology at the Akacievej site is shown in Figure 1 and described in the Chapter [[Geology and properties of limestone]]. | A cross section of the geology at the Akacievej site is shown in Figure 1 and described in the Chapter [[Geology and properties of limestone]]. | ||
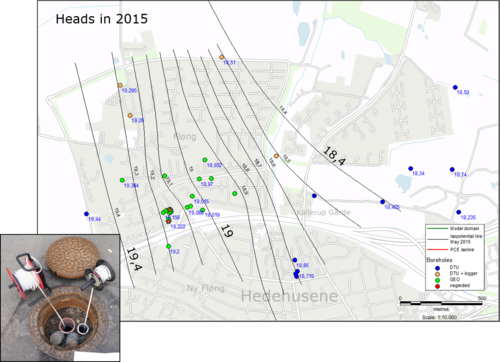
| − | [[File:Heads_Akacievej_2015.png|500px|thumb|Fig.2: Flow field at Akacievej determined by a synchronous head | + | [[File:Heads_Akacievej_2015.png|500px|thumb|Fig.2: Flow field at Akacievej determined by a synchronous head leveling campaign in spring 2015.]] |
=== Flow field and isopotential map === | === Flow field and isopotential map === | ||
| − | To determine, where contaminants may migrate, it is important to have knowledge about the local flow field. | + | To determine, where contaminants may migrate, it is important to have knowledge about the local hydraulic head distribution and flow field. |
| − | At the Akacievej site, a synchronous hydraulic head measurement campaign was done to determine | + | At the Akacievej site, a synchronous hydraulic head measurement campaign was done to determine hydraulic head distribution in the larger plume area. |
Therefore, the hydraulic heads in the boreholes in a larger area around the Akacievej site were leveled on the same day. | Therefore, the hydraulic heads in the boreholes in a larger area around the Akacievej site were leveled on the same day. | ||
| − | + | To obtain the natural groundwater flow field, the remediation system and the waterworks were switched off for the measurements. | |
| + | Based on the measurements, an isopotential map can be created, which can also be useful to delineate the model domain. | ||
Figure 2 shows the isopotential map that was created for the area around the Akacievej field site. | Figure 2 shows the isopotential map that was created for the area around the Akacievej field site. | ||
An extent of the measurement area larger than the plume is beneficial, so flow models with little influence of the boundaries on the flow field can be setup. | An extent of the measurement area larger than the plume is beneficial, so flow models with little influence of the boundaries on the flow field can be setup. | ||
| − | |||
=== Determination of aquifer parameters === | === Determination of aquifer parameters === | ||
| Line 72: | Line 72: | ||
The flow model was used as bases for the transport models. | The flow model was used as bases for the transport models. | ||
| − | The tracer tests allowed to estimate the limestone porosity and an effective diffusivity (the diffusivity had to be increased to account for | + | The tracer tests allowed to estimate the limestone porosity and an effective diffusivity (the diffusivity had to be increased to account for neglected small fractures). |
Porosity and hydraulic conductivity measurements on limestone probes from borehole cores were done with steady-state gas permeameter and porosimeter (PoroPerm) tests. | Porosity and hydraulic conductivity measurements on limestone probes from borehole cores were done with steady-state gas permeameter and porosimeter (PoroPerm) tests. | ||
They were used for the hydraulic properties of the limestone matrix in the discrete-fracture model. | They were used for the hydraulic properties of the limestone matrix in the discrete-fracture model. | ||
Then, the flow model was used as a basis for the transport simulations. | Then, the flow model was used as a basis for the transport simulations. | ||
| − | To analyze the origin of PCE that was observed in the wells at the Akacievej site, the transport model was run on the | + | To analyze the origin of PCE that was observed in the wells at the Akacievej site, the transport model was run on the inverse flow field. |
This method can be employed to analyze the volume, where substances are coming from to the different observation boreholes under pumped and non-pumped conditions. | This method can be employed to analyze the volume, where substances are coming from to the different observation boreholes under pumped and non-pumped conditions. | ||
Revision as of 17:09, 29 January 2018
| Highlights |
|---|
|
ContentsConceptual model developmentThis chapter describes the setup of the conceptual model for the Akacievej field site based on a set of field measurements and modeling.
Geologic modelData from boreholes (drilling reports), borehole cores, geophysical measurements, larger-scale geologic maps and expert knowledge were combined to setup a 3D geologic model using the software GeoScene3D. The top of the limestone layer, the transition from crushed to fractured limestone and the transition from the København's kalk to bryozoan limestone were determined in an array of boreholes and the data was spatially interpolated to obtain 3D surfaces that can be used in a numerical flow and transport model. A cross section of the geology at the Akacievej site is shown in Figure 1 and described in the Chapter Geology and properties of limestone. Flow field and isopotential mapTo determine, where contaminants may migrate, it is important to have knowledge about the local hydraulic head distribution and flow field. At the Akacievej site, a synchronous hydraulic head measurement campaign was done to determine hydraulic head distribution in the larger plume area. Therefore, the hydraulic heads in the boreholes in a larger area around the Akacievej site were leveled on the same day. To obtain the natural groundwater flow field, the remediation system and the waterworks were switched off for the measurements. Based on the measurements, an isopotential map can be created, which can also be useful to delineate the model domain. Figure 2 shows the isopotential map that was created for the area around the Akacievej field site. An extent of the measurement area larger than the plume is beneficial, so flow models with little influence of the boundaries on the flow field can be setup. Determination of aquifer parametersA combination of measures was tested and used to determine the aquifer parameters at the site. A long-term pumping test, short-term pump tests and packer tests, a series of slug tests, a packer test, head measurements of the remediation system and at neighboring waterworks gave information about the hydraulic conditions at the site. At the Akacievej site, the remediation system was turned off and on several times while measuring the head changes in the remediation well and in observation wells in the area. The groundwater flow field with the remedial pumping and without could be determined. The following report contains a detailed description of a long-term pumping test that was conducted at the Akacievej site in combination with six tracer tests and PCE measurements: In total, six tracer tests were completed during the long-term pumping test at Akacievej in spring 2016. Model simulations guided the design of the tracer tests. Tracer was injected at four different screened wells, which have wells screens at different depths. Tracer test description -- use from report Contaminant distribution and dynamicsThe PCE concentrations at the Akacievej site were monitored in the pumped water from the remediation well (PB) since the installation of the remediation system. Additionally, several sampling rounds were done in the period from 2014-2016, using different sampling techniques. The wells were also sampled under different conditions:
This showed strong dynamics of the PCE in the aquifer - the pumping had a strong influence on the observed concentrations in the wells at Akacievej. The different sampling methods that were used are described in detail in the following report (in Danish): To improve the understanding of the contaminant dynamics in the greater source zone under different pumping conditions, a detailed 3D flow and transport model was setup in COMSOL Multiphysics. A discrete-fracture model was used to account for the interactions between major horizontal fractures and matrix. The horizontal fractures had been identified from flow logs in some of the wells in the area. A stationary flow model was setup and compared to the drawdown measurements from the remediation system and from the long-term pumping test using a set of simulations. The fracture aperture and the hydraulic conductivity of the crushed limestone, the fractured limestone were varied to match the observed drawdown in the wells. The flow model was used as bases for the transport models. The tracer tests allowed to estimate the limestone porosity and an effective diffusivity (the diffusivity had to be increased to account for neglected small fractures). Porosity and hydraulic conductivity measurements on limestone probes from borehole cores were done with steady-state gas permeameter and porosimeter (PoroPerm) tests. They were used for the hydraulic properties of the limestone matrix in the discrete-fracture model. Then, the flow model was used as a basis for the transport simulations. To analyze the origin of PCE that was observed in the wells at the Akacievej site, the transport model was run on the inverse flow field. This method can be employed to analyze the volume, where substances are coming from to the different observation boreholes under pumped and non-pumped conditions. TODO
|


