File list
This special page shows all uploaded files.
| Date | Name | Thumbnail | Size | User | Description | Versions |
|---|---|---|---|---|---|---|
| 08:26, 4 July 2019 | Mapcoupled2D-3Dmodel.png (file) |  |
946 KB | Klmos | Overview map showing the extend of the 3D model domain (blue) and the 2D cross section model. | 1 |
| 08:20, 4 July 2019 | Coupled2D-3Dmodel.png (file) |  |
89 KB | Klmos | Grey box was missing | 3 |
| 15:12, 10 April 2019 | Akacievej-Data-og modelgrundlag for revudering af afværgeanlæg.pdf (file) | 4.73 MB | Klmos | Report about the Akacievej site, that provides measured data and modeling towards the re-evaluation of the remediation system | 1 | |
| 21:05, 13 February 2018 | Stroemning og stoftransport i kalklagene pa den koebenhavnske vestegn.pdf (file) | 29.01 MB | Klmos | Report by the Geological Survey of Denmark and Geo | 1 | |
| 22:17, 5 February 2018 | SnapSampler1.jpg (file) |  |
1.43 MB | Klmos | Installation of snap samplers in a borehole. | 1 |
| 22:16, 5 February 2018 | SnapSampler2.jpg (file) |  |
502 KB | Klmos | Snap sampler. | 1 |
| 22:14, 5 February 2018 | BladderPump.jpg (file) |  |
338 KB | Klmos | Bladder pump with equipment. | 1 |
| 09:22, 14 March 2017 | Overview reports and publications limestone project.pdf (file) | 612 KB | Klmos | Overview of reports, student projects/theses, conference presentations and publications | 1 | |
| 17:39, 16 February 2017 | FlowLogs Fractures.png (file) |  |
116 KB | Klmos | 2 | |
| 14:37, 16 February 2017 | SlugTest.jpg (file) |  |
1.01 MB | Klmos | Slug test performed at the Akacievej site | 1 |
| 12:47, 15 February 2017 | PumpTracerTest-images.png (file) | 1.22 MB | Klmos | Photos from the pumping test and the tracer tests at Akacievej (spring 2016). | 1 | |
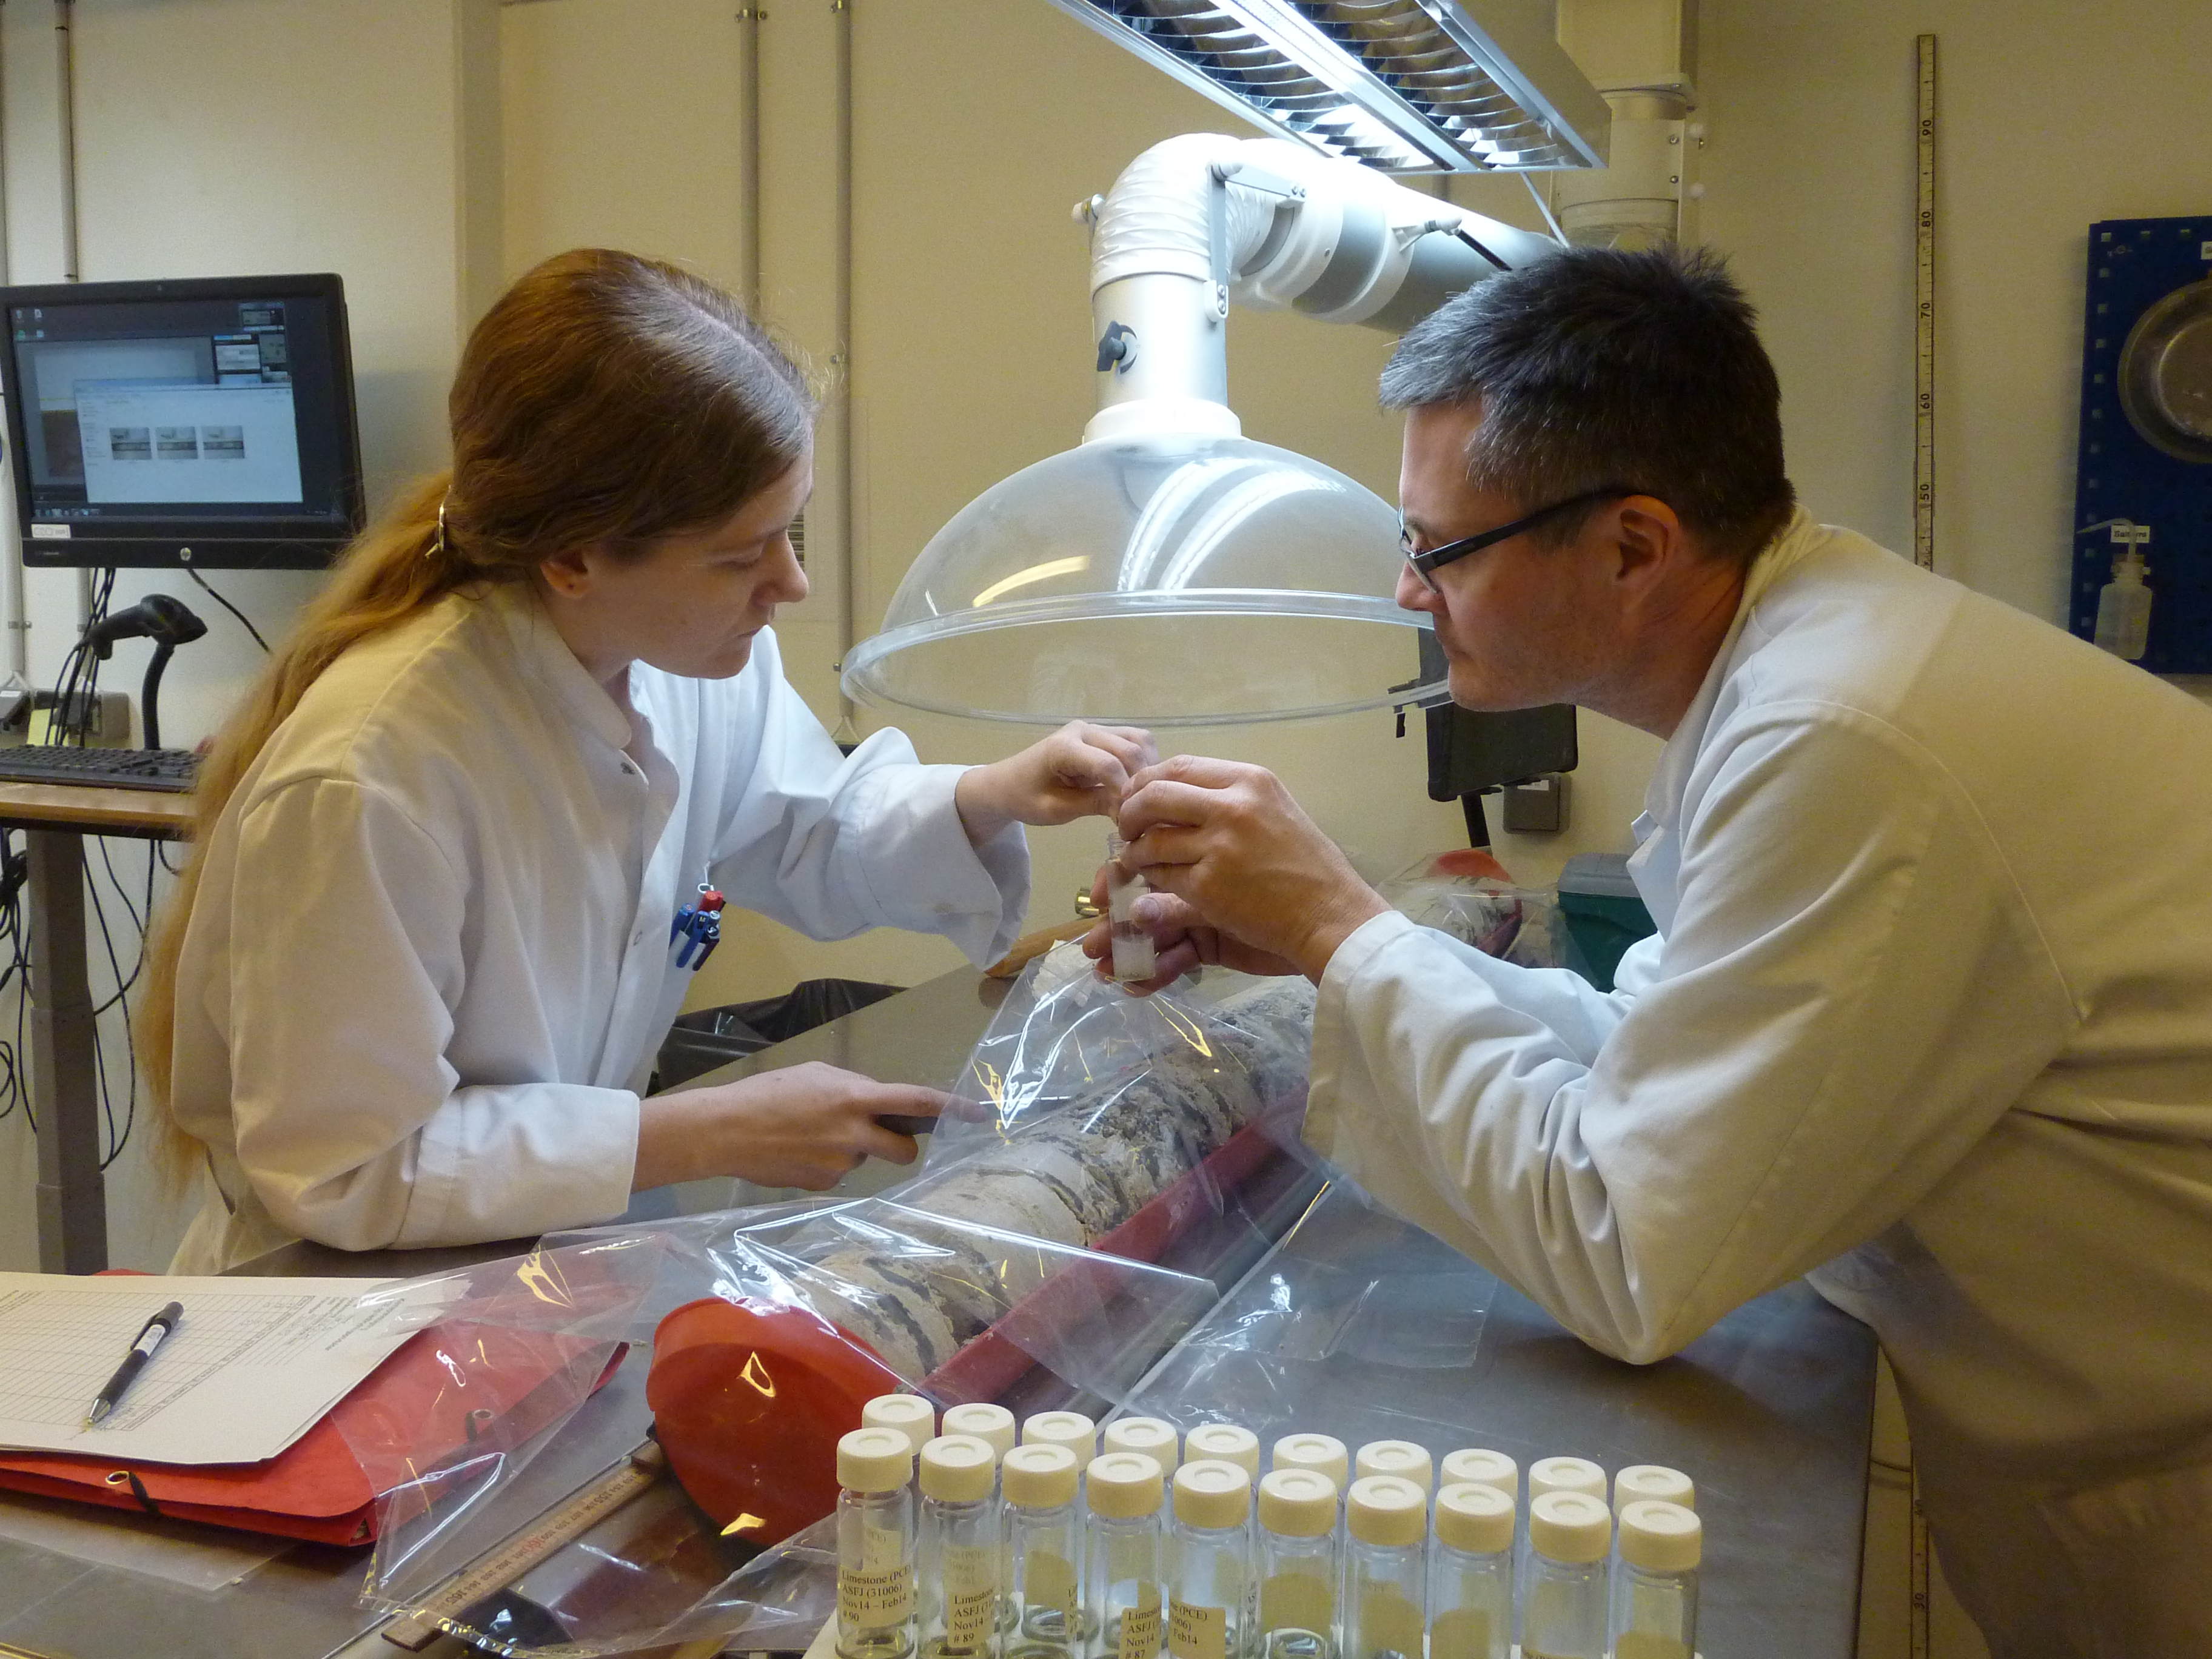
| 12:33, 15 February 2017 | Core-analysis.jpg (file) |  |
758 KB | Klmos | Extraction of samples for the lab analysis for sorbed PCE and TCE | 1 |
| 12:20, 15 February 2017 | Geo4-17.jpg (file) |  |
648 KB | Klmos | Example for a borehole core with substantial core losses. | 1 |
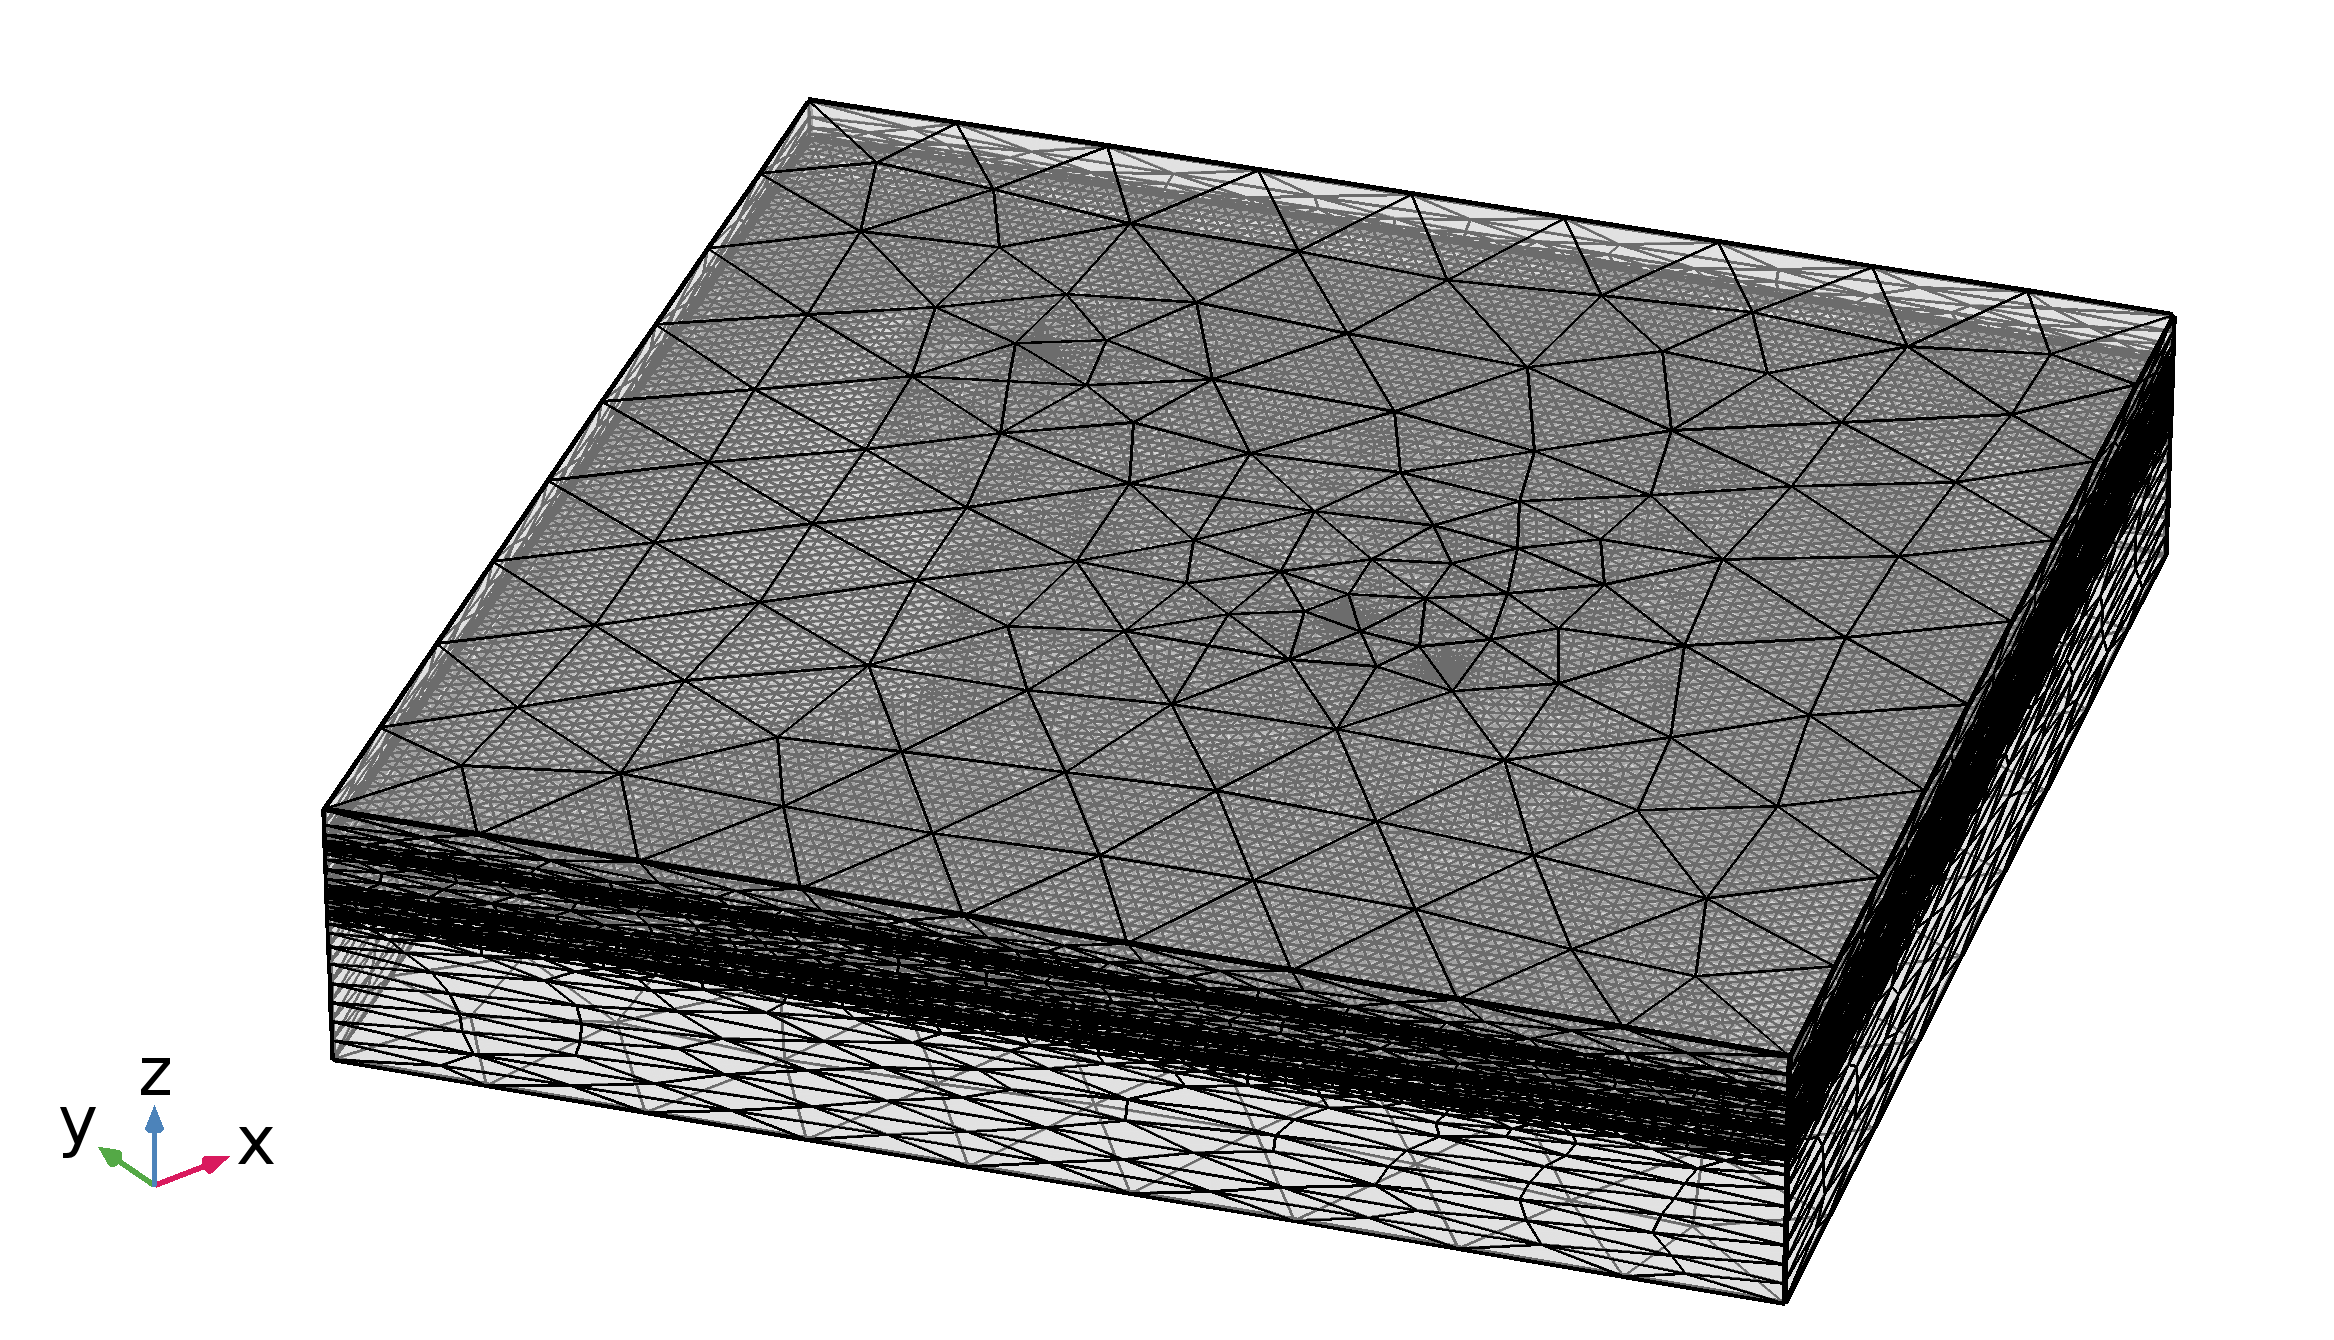
| 13:36, 8 February 2017 | MeshExample.png (file) |  |
394 KB | Klmos | Example of a tetrahedral mesh used in a discrete-fracture model with refinements at the horizontal fractures and at the wells. Approximately 1.5 Mio. elements. | 1 |
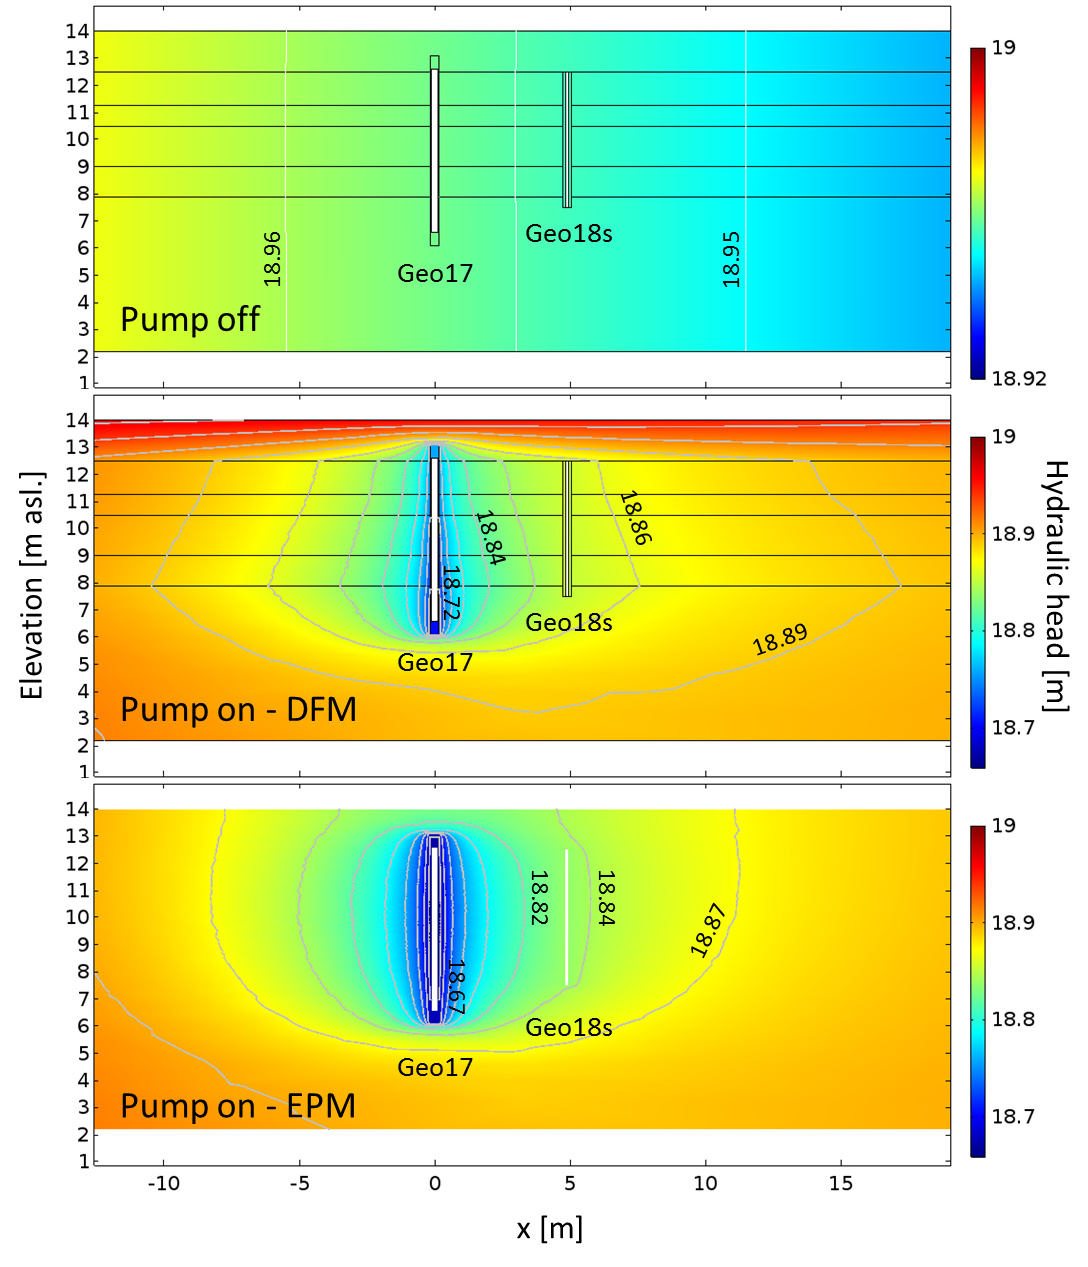
| 13:27, 8 February 2017 | HeadsAroundGeo17.png (file) |  |
659 KB | Klmos | Hydraulic head distribution around the well Geo17, which was used as pumping well in the pumping test. The first figure shows the heads without pumping, the second shows the heads while pumping using a DFM, the third shows the same setup using an EPM m... | 1 |
| 09:53, 7 February 2017 | GeologicSequenceGEUS2014.png (file) |  |
339 KB | Klmos | Figure from GEO/GEUS 2014 report showing the geologic stratigraphy | 1 |
| 12:14, 24 January 2017 | OverviewMapAkacievej.png (file) |  |
796 KB | Klmos | Map showing the location of the Akacievej site. | 1 |
| 10:45, 24 January 2017 | OTVexample.jpg (file) |  |
212 KB | Klmos | Shorter version | 3 |
| 09:08, 24 January 2017 | Pumping and tracer test report.pdf (file) | 5.1 MB | Klmos | Report about the pumping test and the forced-gradient tracer tests performed at the Akacievej site in spring 2016. | 1 | |
| 08:56, 24 January 2017 | Sammenligning af niveauspecifikke prøvetagningsmetoder.pdf (file) | 6.3 MB | Klmos | Report with sampling method comparison and contaminant data at Akacievej | 1 | |
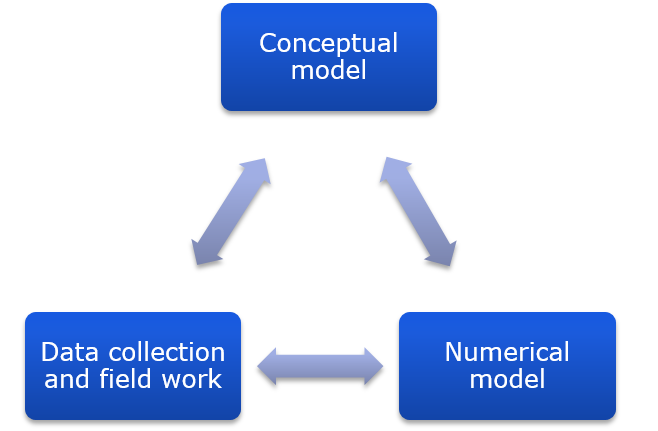
| 12:48, 16 January 2017 | IntegratedModelingApproach.png (file) |  |
35 KB | Klmos | Integrated modeling approach: close link between modeling, data collection and field work and update of the conceptual understanding. | 1 |
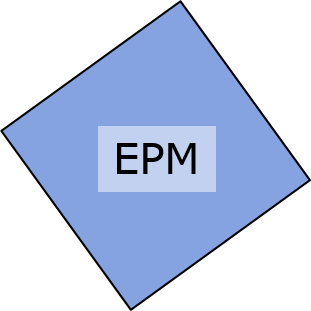
| 15:15, 11 January 2017 | EPM square.png (file) |  |
7 KB | Klmos | Schematic figure of an equivalent porous medium model. | 1 |
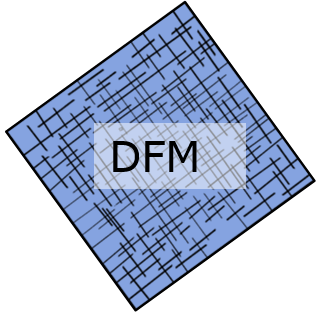
| 15:13, 11 January 2017 | DFM.png (file) |  |
57 KB | Klmos | Schematic figure of a discrete fracture model. | 1 |
| 09:00, 16 September 2016 | PlumeExtent2006-2015.png (file) |  |
478 KB | Klmos | Map showing remediation system and plume extent in 2006 and 2015. | 1 |
| 15:46, 15 September 2016 | PCE distribution wRemediation.png (file) |  |
287 KB | Klmos | PCE distribution at Akacievej with remediation system on. | 1 |
| 15:44, 15 September 2016 | Heads Akacievej 2015.png (file) |  |
1.19 MB | Klmos | Heads at Akacievej measured with GEO in May 2015 | 1 |
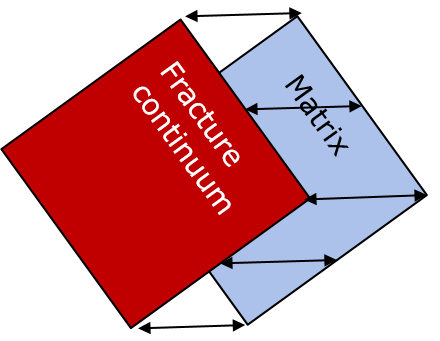
| 06:50, 15 June 2016 | DualContinuumSchematics.png (file) |  |
24 KB | Klmos | The dual continuum approach. | 1 |
| 06:32, 15 June 2016 | TransportEquation.png (file) | 6 KB | Klmos | Transport equation for an EPM model | 1 | |
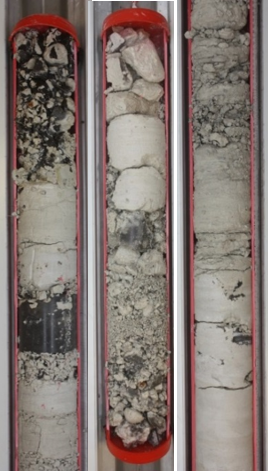
| 06:18, 15 June 2016 | BoreholeCores.png (file) |  |
345 KB | Klmos | Picture of three borehole cores from the Akacievej site | 1 |
| 17:09, 14 June 2016 | Geology Akacievej GEO extended.png (file) |  |
954 KB | Klmos | blue line is longer | 3 |
| 14:36, 23 May 2016 | SE-NO profil.jpg (file) |  |
370 KB | Klmos | Example of a Geoscene3D profile | 1 |
| 06:29, 21 April 2016 | RegionH logo.png (file) | 11 KB | Klmos | Region H logo | 1 | |
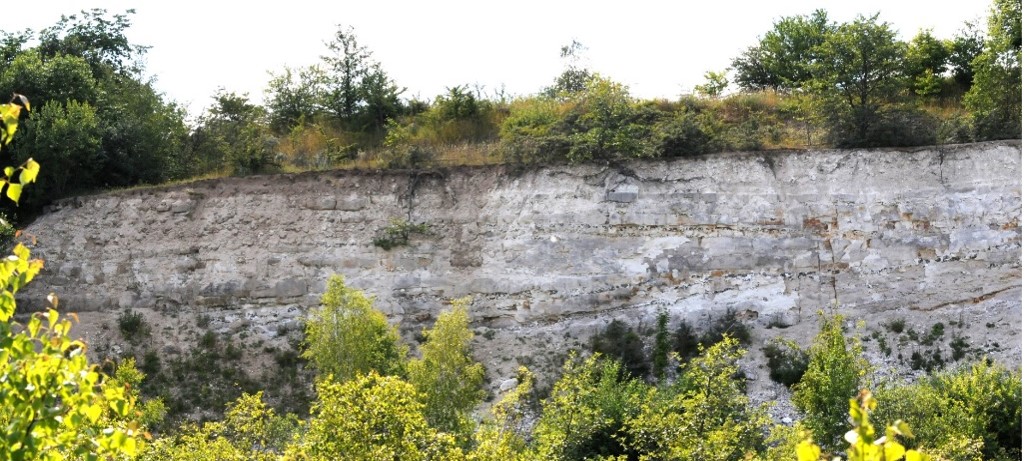
| 13:28, 20 April 2016 | Outcrop small.jpg (file) |  |
197 KB | Klmos | Photo of a limestone outcrop | 1 |
| 12:31, 20 April 2016 | Slugtest GEO19s KGS Aqtesolv.png (file) |  |
21 KB | Klmos | Example image for a slug test interpretation in Aqtesolv using the KGS method for Geo19s. | 1 |
| 15:17, 19 April 2016 | WeakFormulation toolbox.pdf (file) | 93 KB | Klmos | Instructions for setting up a fracture flow and transport model in Comsol using the weak contributions | 1 | |
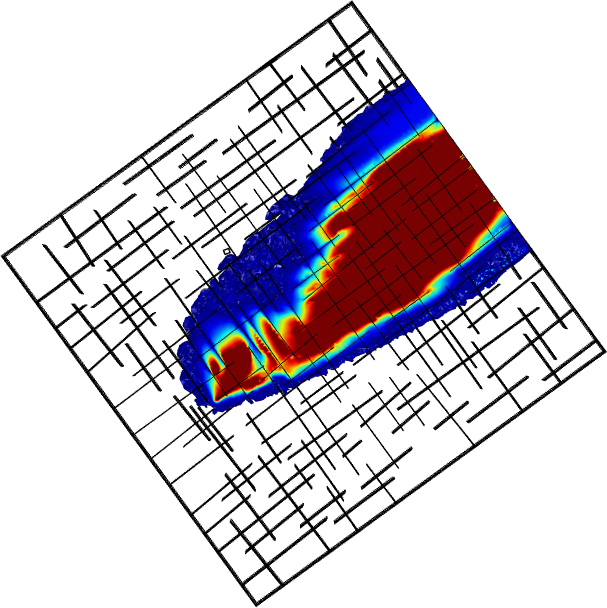
| 12:44, 5 April 2016 | CaptureZones Akacievej.png (file) |  |
722 KB | Klmos | Sample file produced with the Matlab script to compute capture zones | 1 |
| 10:58, 5 April 2016 | CaptureZones MATLAB.zip (file) | 895 KB | Klmos | Matlab script to compute capture zones of wells and background image | 1 | |
| 09:01, 5 April 2016 | Plume DFM 8yrs highKcontrast-50ug.png (file) |  |
145 KB | Klmos | Example for modeled plume propagation in fractured aquifer using a DFM | 1 |